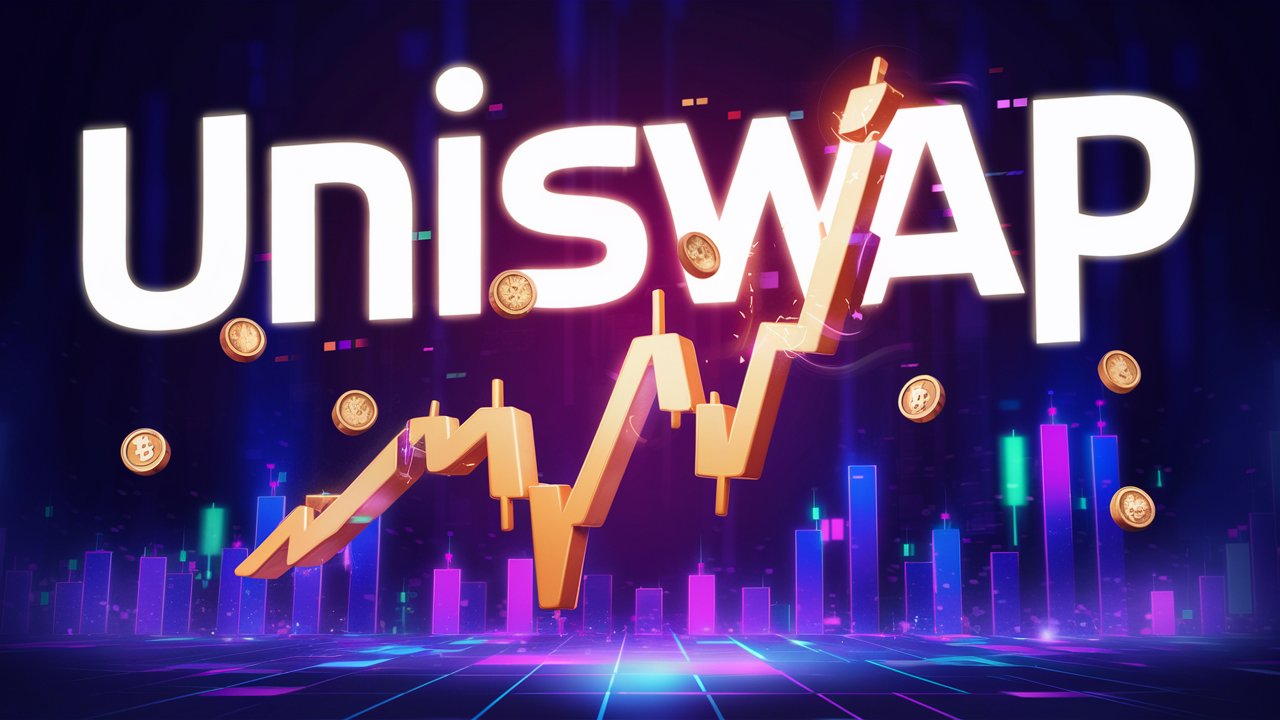
Uniswap recently announced that candlestick charts are now available on their platform, enhancing users’ ability to make informed financial decisions. This new feature visually represents an asset’s trading activity, aiding investors in analyzing price movements and market sentiment.
The announcement of candlestick charts on Uniswap was made via a post on the official Uniswap Labs X page and has generated excitement and interest within the cryptocurrency community.
Understanding candlestick charts
Candlestick charts are widely used in the crypto industry. They provide essential information, including opening and closing prices, the highest and lowest prices within a specific period, and overall price trends. These charts enable investors to assess an asset’s performance quickly and make timely decisions about buying or selling.
Uniswap’s integration of candlestick charts is a significant development. It allows users to monitor real-time price fluctuations for various assets. This feature is particularly valuable because Uniswap is a decentralized exchange, offering users access to long-term data that can inform their trading strategies.
Using candlestick charts, users can identify spot trading patterns and assess which assets are currently in demand. This insight empowers traders to capitalize on market trends and optimize their trading strategies for financial success.
Uniswap’s mission to provide innovative tools for smarter trading decisions aligns with the introduction of candlestick charts. Users can quickly access these analytical tools by clicking the explore button on the Uniswap website or wallet app.
Benefits of live candlestick charts on Uniswap
The benefits of live candlestick charts extend beyond basic price tracking. They offer valuable insights into market sentiment, highlighting periods of optimism or pessimism among traders. This psychological aspect of trading can influence decision-making, allowing users to anticipate potential gains or losses based on market behavior.
The charts show price changes with color-coded bars, usually red and green, revealing if an asset’s value has risen or fallen over a set period. The bars’ size and shape represent the strength of price movements, clearly depicting market trends.
With candlestick charts now live on Uniswap, users have a comprehensive toolset to navigate the complexities of crypto trading. By understanding market trends and sentiment, investors can make more confident decisions and optimize their trading strategies.
Uniswap’s commitment to continuous improvement is evident in the rollout of new features like candlestick charts. This enhancement reflects a broader trend in the cryptocurrency industry toward greater accessibility and transparency for traders.
Also read: Coinbase Sued Amid Allegations of Deceiving Investors
Discover more from The African Crypto
Subscribe to get the latest posts to your email.


